One ownership structure. A chart for every question asked of it.
Lextree is ownership chart software that draws each chart from the ownership records you already keep and lays the chart out. Start from any company or person and walk owners or holdings for as many levels as you choose. Filter by condition, and keep a chart for each question: one for the lender, another for the auditor, another for the board.
Every card is a record. Every link shows who owns what.
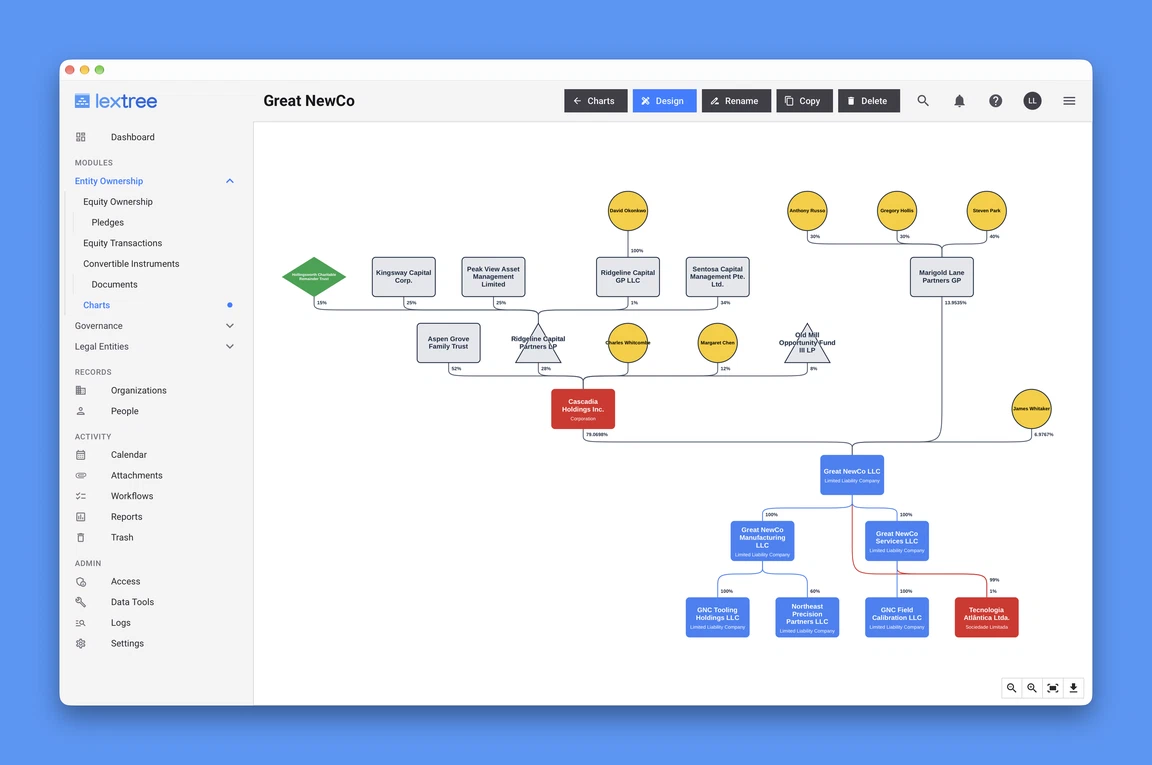
From ownership records to the corporate structure chart each reader needs.
A chart for each purpose
The KYC file, the lender, the auditor, and the board each ask a different question of the same structure. Make a chart for each one from the same records. Each chart keeps its own selection of them and its own look.
The whole group or one branch
Show each reader only the part of the structure they asked about. Start from any company or person and walk up through its owners, down through its holdings, or both without side branches, for as many levels as you set. Or take the whole group the record belongs to, or leave the start empty to chart every link you have recorded.
Conditions, including a date
A narrower question gets a narrower chart. A condition names a field, a comparison, and a value, such as a status, a jurisdiction, or an acquisition date before a certain day. Conditions on the acquisition and disposition dates show who owned what on that day, such as year end. The chart's percentages are the ones recorded on the ownership record, not the ones held then.
Lextree lays it out
Save a chart and Lextree draws it, with owners above the companies they own by default. Lextree places the cards, so the first picture is already arranged. Drag a card where you want it. You can lay out the whole chart afresh, or just one branch, at any time. If a card could not be placed or text had to be cut, a Checks list says so.
A chart that knows when it is stale
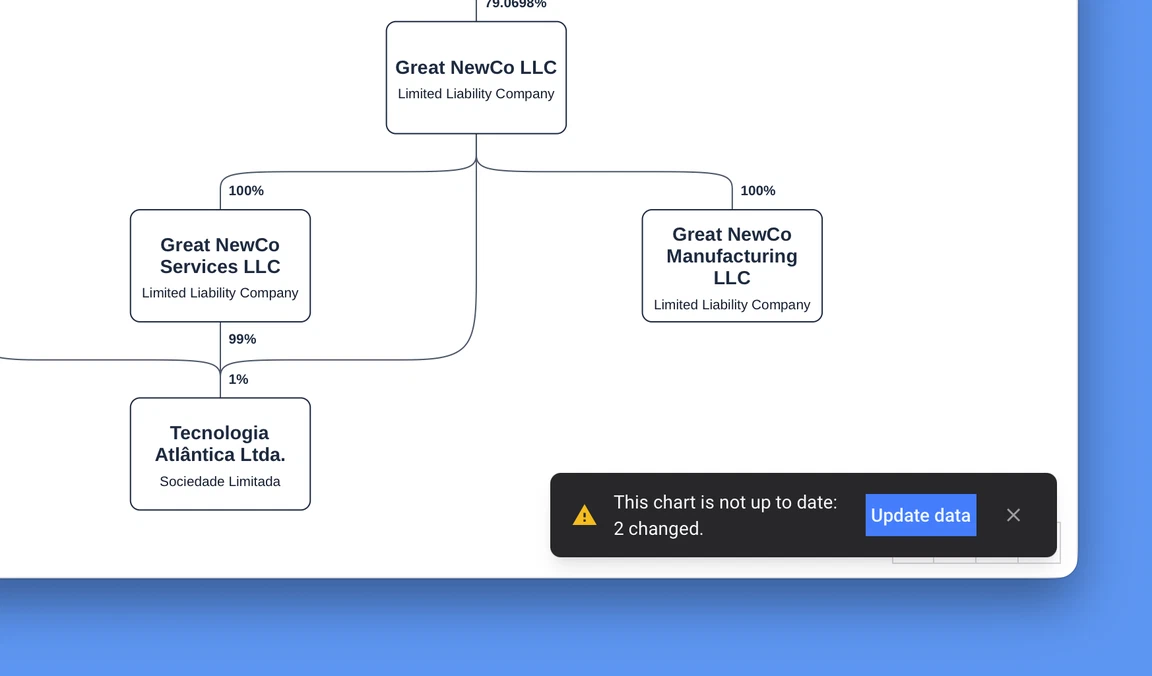
Open a chart and Lextree checks it against your records. A message lists changed names or values, cards an edited link would bring in, and records that were trashed. A warning mark stays beside the chart's name.
Download, API, and AI assistant
Send each reader a file that matches the screen. Download a chart as SVG, PDF, PNG, or JPG, drawn by the same engine as the screen. On the Enterprise plan, a program can reach charts through the API, and you can reach them by asking the AI assistant. Either route can create a chart, regenerate it, check whether it is out of date, and fetch its SVG.
From a question to a chart file in three steps.
Choose the scope
Pick a starting organization or person, a direction, a depth, and any conditions, including dates. Check selection counts the cards and links before anything is drawn.
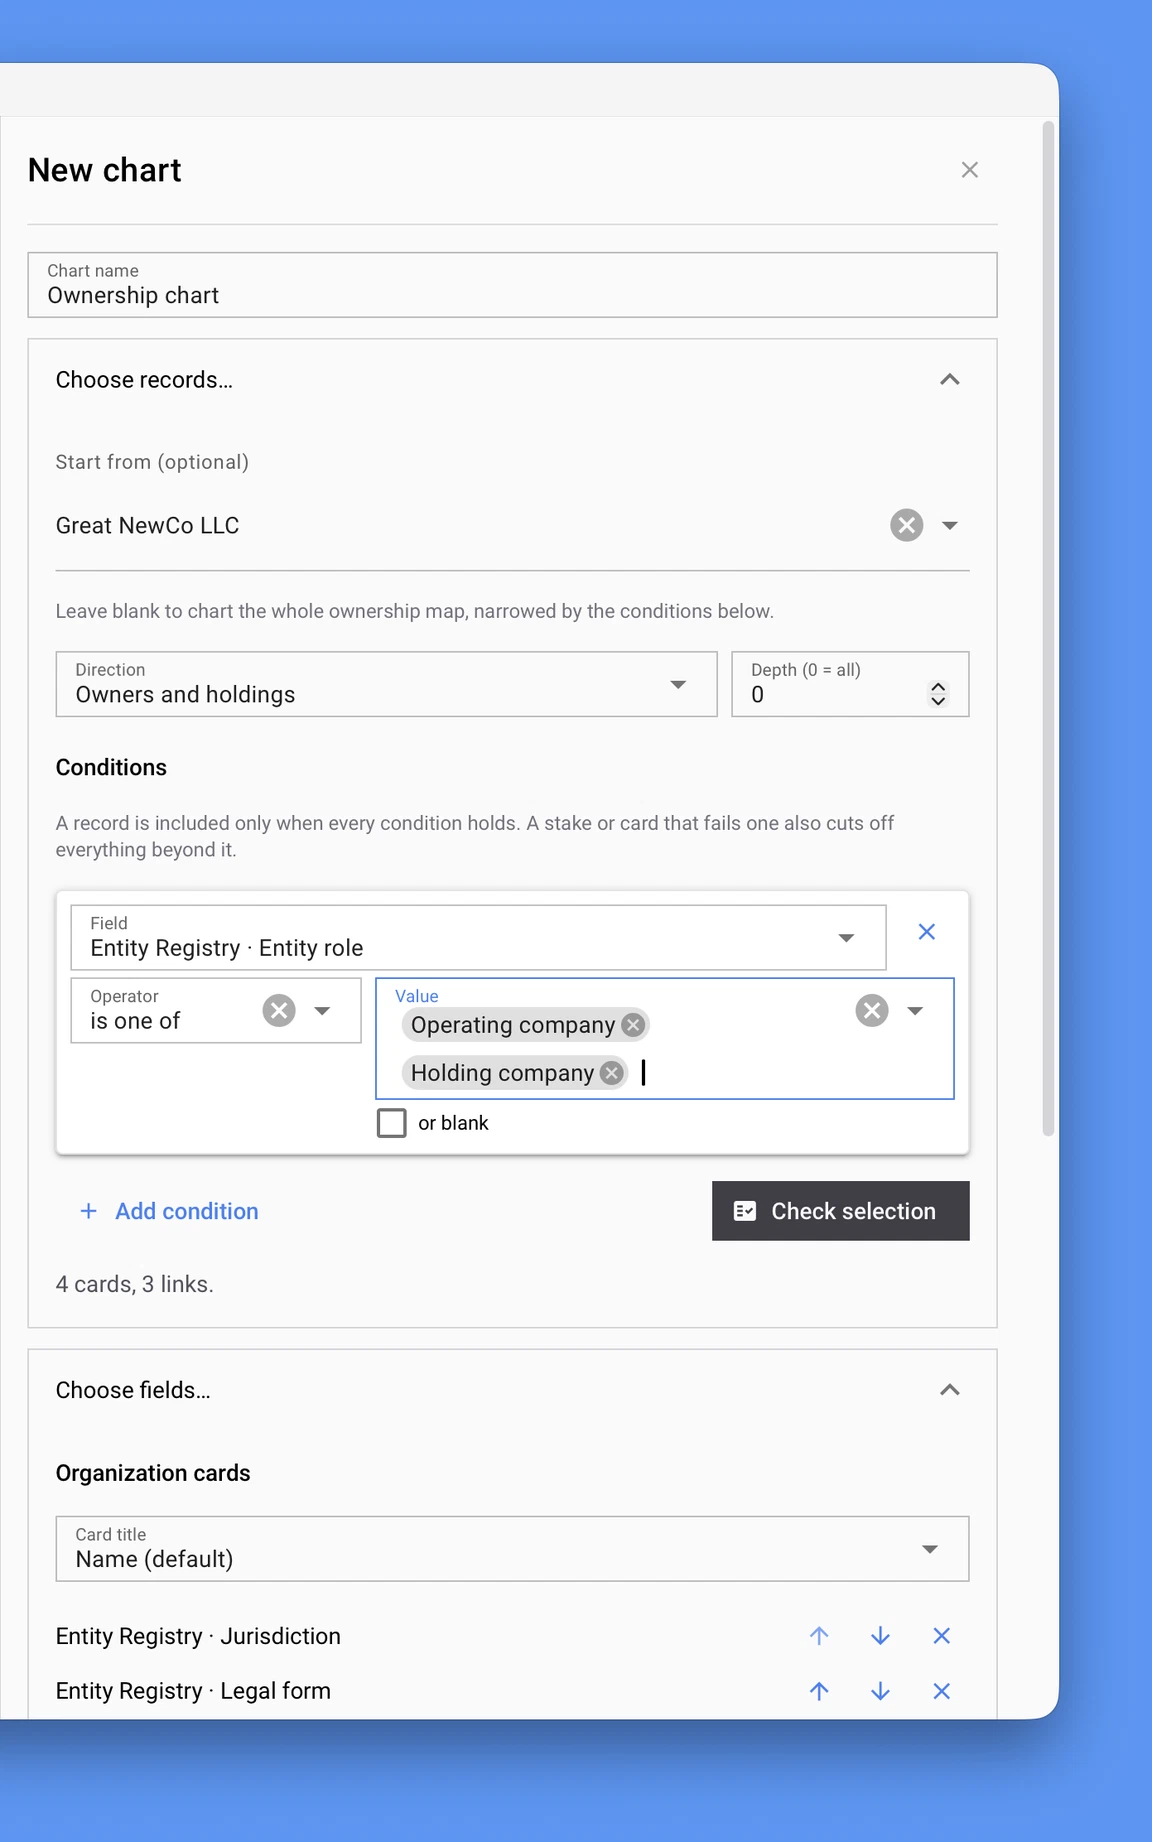
Start from Great NewCo LLC, filter by entity role, and Check selection counts the result before anything is drawn. Lextree lays it out, you adjust
Adjust the drawing to suit the reader. Lextree draws the chart and places the cards. Pick which fields show on cards and links, such as the percentage, so each link answers the reader's question. Set a look for a type of card or a branch, so cards added later match that look. Every change saves as you make it, and undo goes back fifty steps, so you can try a change and step back.
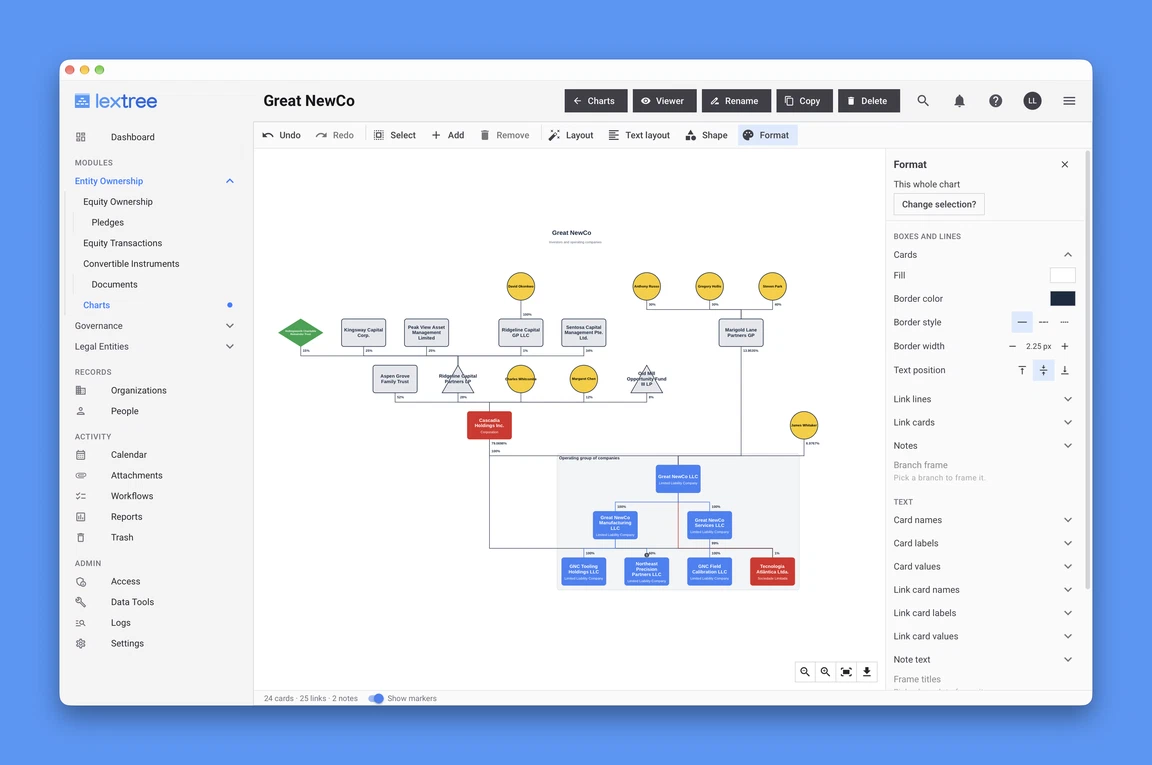
The designer with a laid-out chart and the Format panel open for cards, links, and text. Download and share
Anyone with Entity Ownership access can open the chart in the viewer. To share it outside Lextree, download it as SVG, PDF, PNG, or JPG for the lender, the auditor, or the board book.
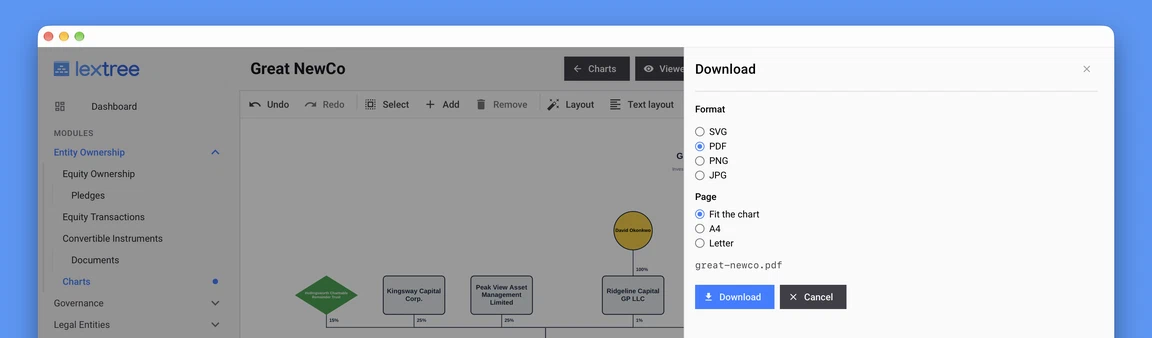
The Download dialog: choose a format, then a page that fits the chart, A4, or Letter. 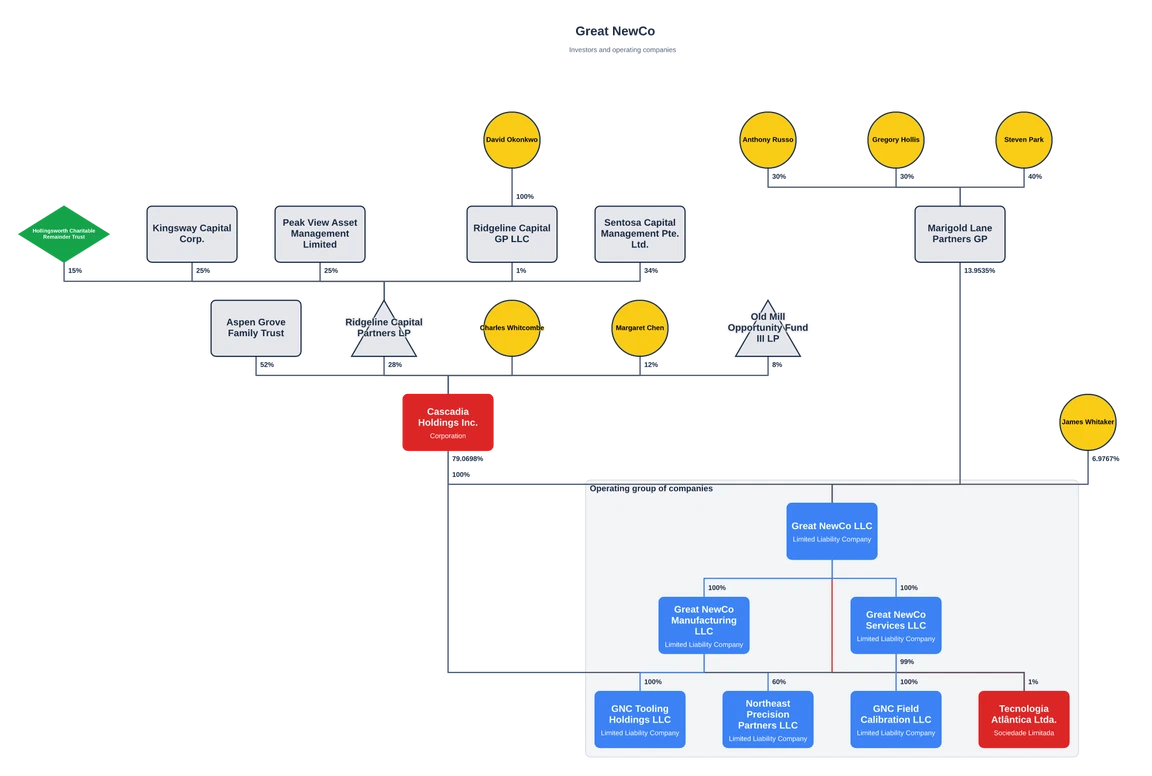
The downloaded PNG. Same engine, same picture.
One structure, drawn at two scopes.
Take the whole group for the board book. Start from one company and walk only its holdings, or only its owners, for the tax adviser or the lender. Both charts read the same records, and each keeps the selection and look you gave it.
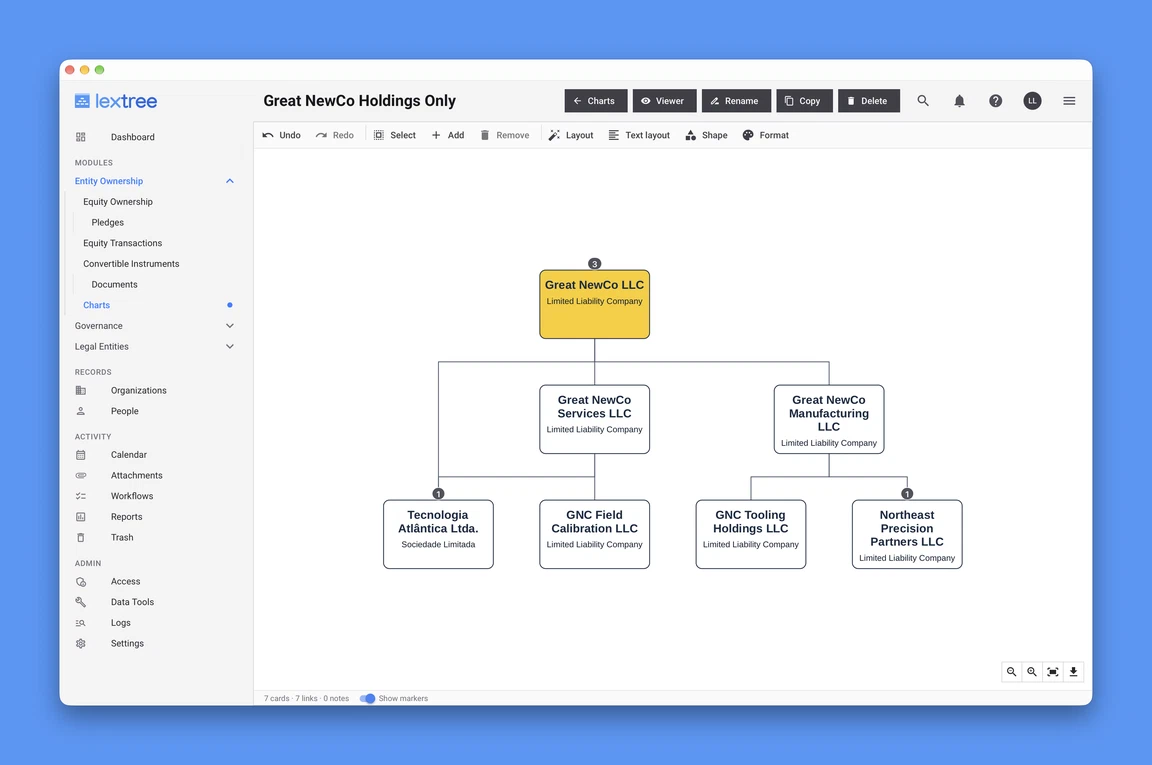
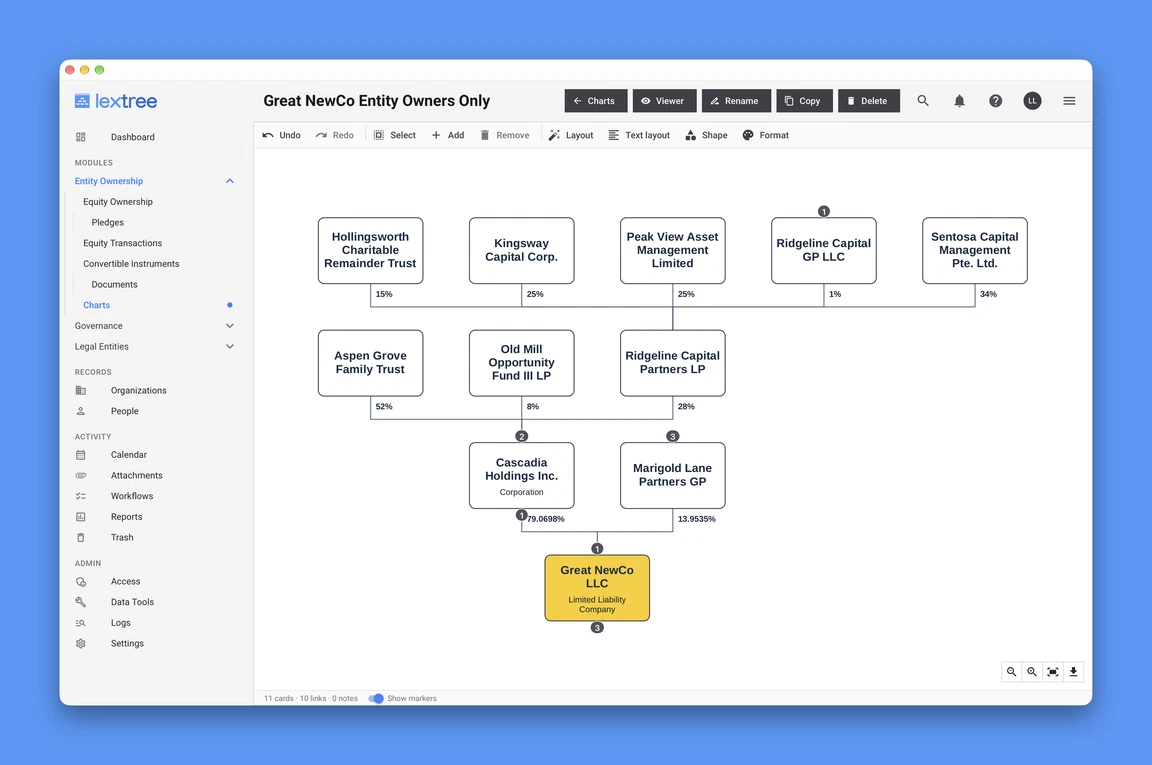
The picture tells you when it no longer matches the records.
A saved chart is a snapshot. Each time it opens, Lextree lists what changed: a renamed holder, a new percentage, a replaced owner, a trashed record. A warning mark stays beside the chart's name until an editor updates it. Update values only leaves each card where it is. Update and lay out afresh arranges the whole chart again.
- Changed
- names and values that differ from the records
- Added
- cards an edited link would bring in
- Removed
- records trashed or deleted since the chart was drawn
The question each reader asks, and the chart that answers it.
A lender asks: who owns the borrower, and through what?
Walk owners upward from the borrower with an Owners chart, then download it as a PDF for the credit file.
An auditor asks: who owned what at year end?
Add conditions on the acquisition and disposition dates so the chart shows who owned what on that day. The chart's percentages are the ones on the records, not the ones held then.
A board asks: what does the group look like now?
Draw a Whole group chart from the current records, and watch for the warning mark that says the records have moved on. Update the chart before it goes in the board book.
Tax asks: how does this one branch hold together?
Start at the top company of the branch and walk its holdings, with the ownership percentage shown on each link.
A deal team asks: what is the group after this deal?
Draw a new Whole group chart from the updated ownership records. Lextree's default post-acquisition checklist includes a "Group structure chart" line among the registers and filings to mark as updated.
Frequently asked questions.
Can I chart one branch instead of the whole group?
Can I chart the structure as it stood on a past date?
How many charts can I keep?
Which plans include ownership charts?
What does an entity ownership chart draw from?
Do new ownership records appear on the chart by themselves?
Can two people edit a chart at once?
Who can see a chart?
See your structure drawn from the record.
Ownership charts come with the Business and Enterprise plans, and every trial is a 14-day Enterprise trial. Draw one from your own records, or ask for a walkthrough of your structure.